

ab 26,00 €
-
 Fototapeten
 - Fototapeten Alle anzeigen
- Fototapeten
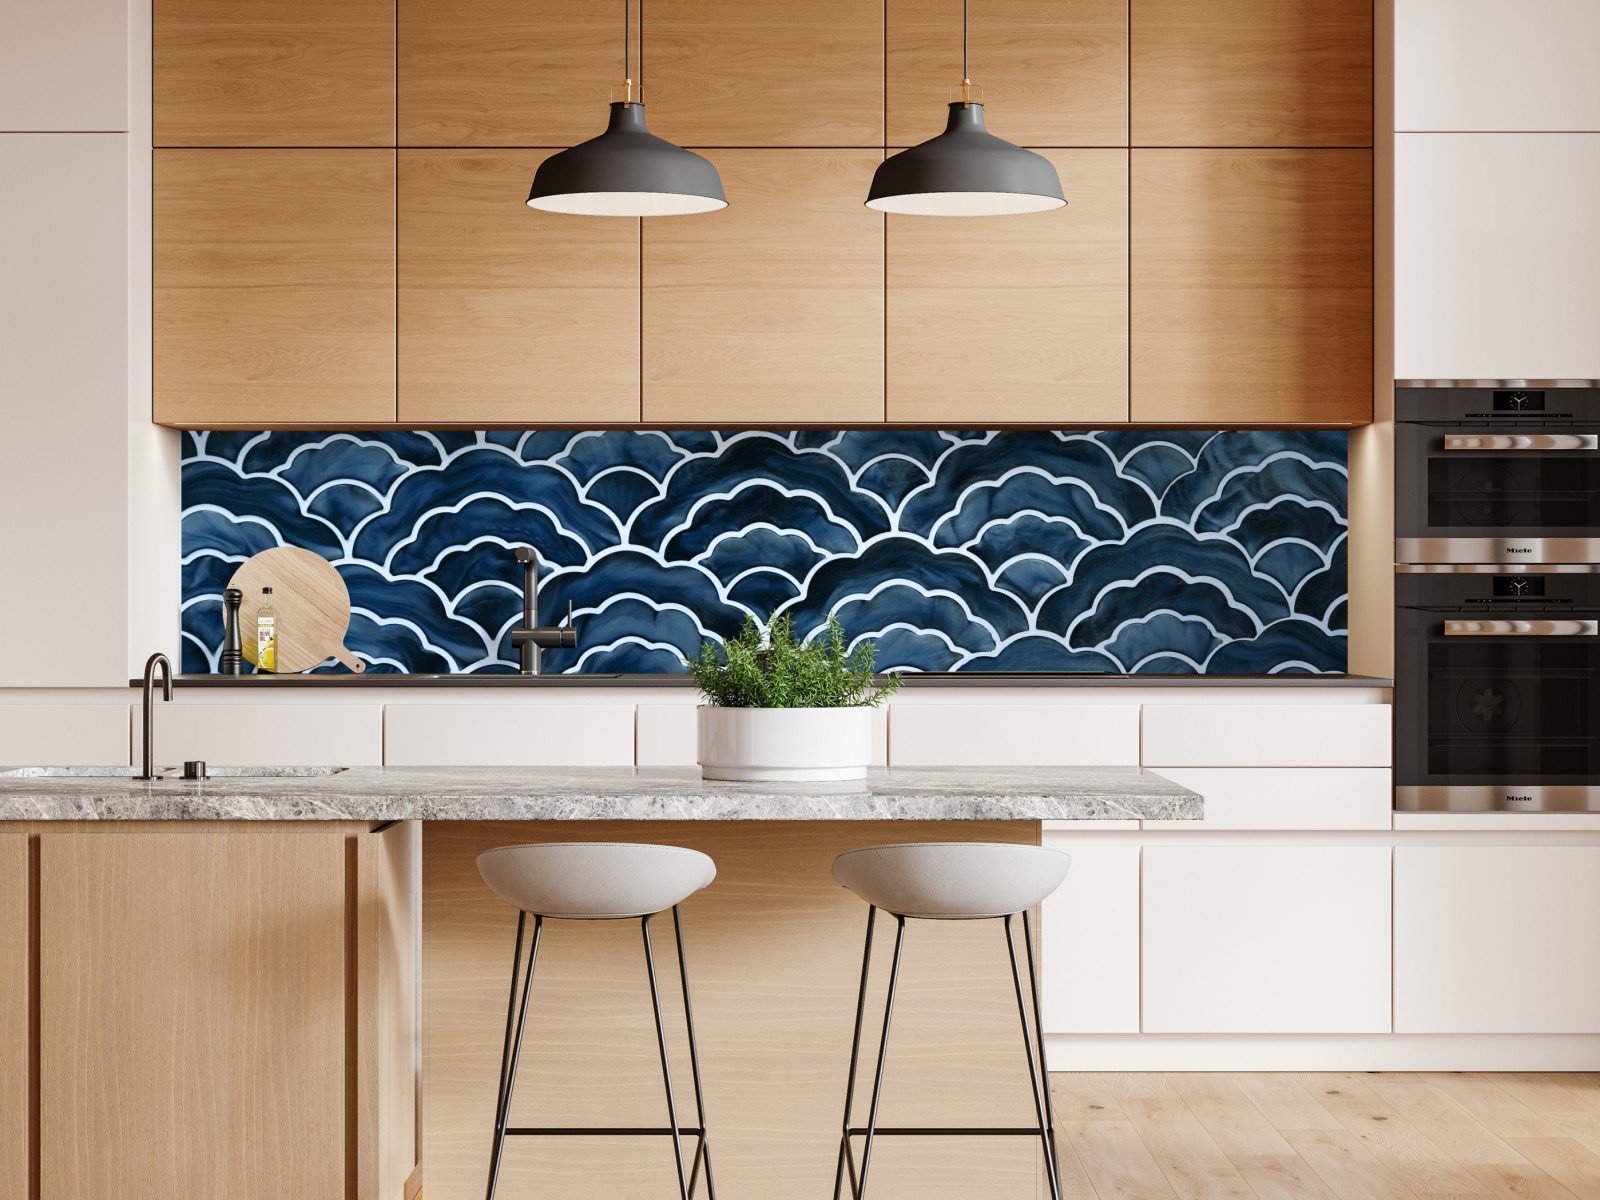
Fototapeten nach Maß verwandeln jeden Raum spektakulär. Wir drucken exakt nach Ihren Maßen – perfekt passend, ohne Zuschneiden, ohne Kompromisse.
Entdecken
-
 Leinwandbilder
 -
 Poster
 -
 Aufkleber
 - Repositionierbare Aufkleber Alles anzeigen
- Repositionierbare Aufkleber
Verändere deinen Stil, wann du willst – stressfrei und rückstandslos! Unsere wiederablösbaren Sticker sind perfekt für Veränderungslustige, ohne Schäden oder Klebereste an Wänden oder Möbeln. Stil und Freiheit in einem!
Entdecken
- Tischaufkleber Alle anzeigen
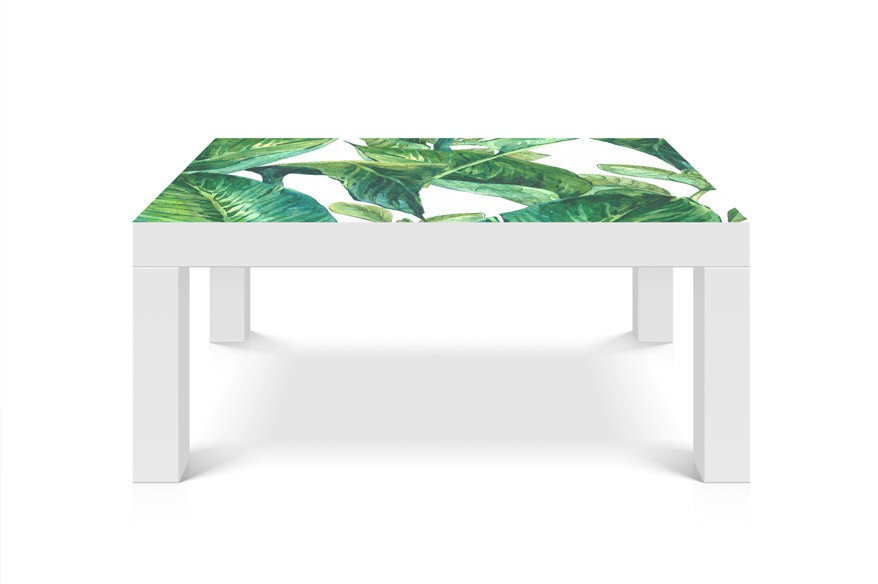
- Tischaufkleber
Vom Büro bis zum Kinderzimmer – unsere Tisch- und Schreibtischaufkleber passen überall. Die hochwertige Folie ist abriebfest und leicht zu reinigen. Eine einfache Lösung für eine schnelle und dauerhafte Verwandlung.
Entdecken
- Kühlschrankaufkleber Alles anzeigen
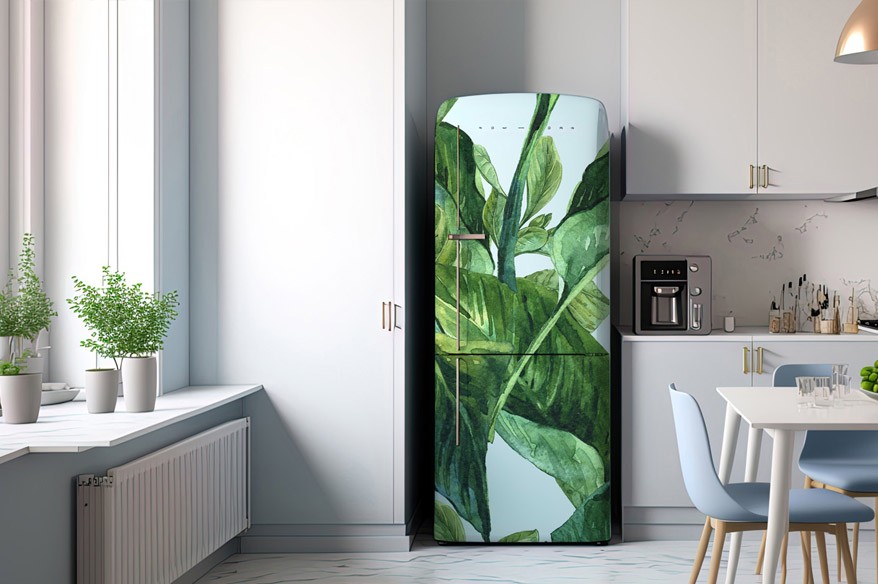
- Kühlschrankaufkleber
Du musst keinen neuen Kühlschrank kaufen, um ihn zu lieben! Einfach bekleben – wähle ein Muster, klebe es in wenigen Augenblicken auf und freue dich jeden Tag über den „Wow“-Effekt!
Entdecken
- Fensteraufkleber Alle anzeigen
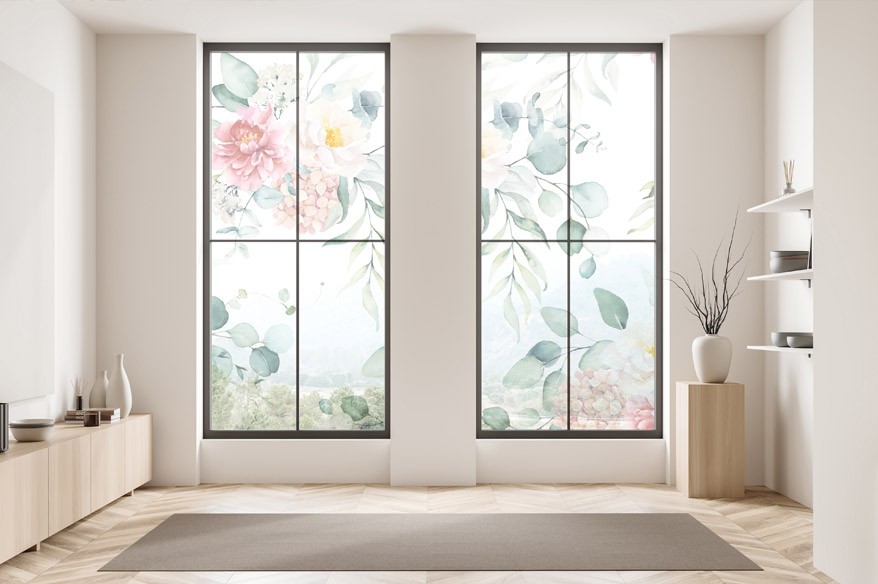
- Fensteraufkleber
Das Licht bleibt, die Stimmung ändert sich. Mit unseren transparenten Aufklebern veränderst du das Aussehen deiner Fenster, ohne auf natürliches Licht zu verzichten. Perfekt für Wohnzimmer, Badezimmer, Küche oder Büro – ästhetisch, leicht und funktional.
Entdecken
Leinwandbilder interface graph - Seite 91
Gefunden 4 994 413 Ergebnisse

ab 26,00 €

ab 26,00 €

ab 26,00 €

ab 26,00 €

ab 26,00 €

ab 26,00 €

ab 26,00 €

ab 26,00 €

ab 26,00 €

ab 26,00 €

ab 26,00 €

ab 26,00 €

ab 26,00 €

ab 26,00 €

ab 26,00 €

ab 26,00 €

ab 26,00 €

ab 26,00 €

ab 26,00 €

ab 26,00 €

ab 26,00 €

ab 26,00 €

ab 26,00 €

ab 26,00 €

ab 26,00 €

ab 26,00 €

ab 26,00 €

ab 26,00 €

ab 26,00 €

ab 26,00 €

ab 26,00 €

ab 26,00 €

ab 26,00 €

ab 26,00 €

ab 26,00 €

ab 26,00 €

ab 26,00 €

ab 26,00 €

ab 26,00 €

ab 26,00 €

ab 26,00 €

ab 26,00 €

ab 26,00 €

ab 26,00 €

ab 26,00 €

ab 26,00 €

ab 26,00 €

ab 26,00 €

ab 26,00 €

ab 26,00 €

ab 26,00 €

ab 26,00 €

ab 26,00 €

ab 26,00 €

ab 26,00 €

ab 26,00 €

ab 26,00 €

ab 26,00 €

ab 26,00 €

ab 26,00 €

ab 26,00 €

ab 26,00 €

ab 26,00 €

ab 26,00 €

ab 26,00 €

ab 26,00 €

ab 26,00 €

ab 26,00 €

ab 26,00 €

ab 26,00 €

ab 26,00 €

ab 26,00 €

ab 26,00 €

ab 26,00 €

ab 26,00 €

ab 26,00 €

ab 26,00 €

ab 26,00 €

ab 26,00 €

ab 26,00 €

ab 26,00 €

ab 26,00 €

ab 26,00 €

ab 26,00 €

ab 26,00 €

ab 26,00 €

ab 26,00 €

ab 26,00 €

ab 26,00 €

ab 26,00 €

ab 26,00 €

ab 26,00 €

ab 26,00 €

ab 26,00 €

ab 26,00 €

ab 26,00 €

ab 26,00 €

ab 26,00 €

ab 26,00 €

ab 26,00 €

ab 26,00 €

ab 26,00 €

ab 26,00 €

ab 26,00 €

ab 26,00 €

ab 26,00 €

ab 26,00 €

ab 26,00 €

ab 26,00 €

ab 26,00 €

ab 26,00 €

ab 26,00 €

ab 26,00 €

ab 26,00 €

ab 26,00 €

ab 26,00 €

ab 26,00 €

ab 26,00 €

ab 26,00 €
Anzeigen 10 801 - 10 920 von 4 994 413 Ergebnissen